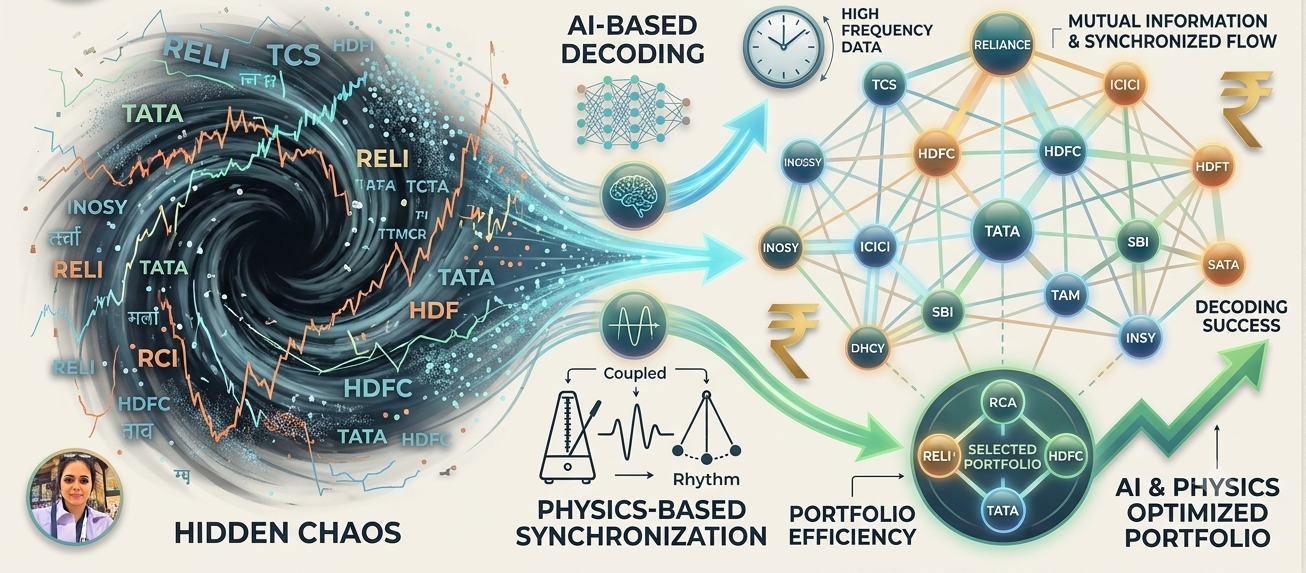
Traditional financial tools often struggle to capture the true complexity of how stocks move together. While many investors rely on simple linear correlation to understand market relationships, these standard methods frequently fail to account for the “messy,” non-linear, and lagged co-movements that define real-world trading. When markets turn volatile, these surface-level metrics often break down, leaving portfolios exposed to risks that traditional models never saw coming. One of my recent research with my student Mr. Sanjay Sathish from the Shiv Nadar Institution of Eminence also presented at the 34th European Conference on Operational Research, offers a more sophisticated approach. By analyzing 21 years of Indian stock market data (2002–2023), we tried to move beyond simple price trends to train Artificial Intelligence on the concept of “synchronization.” This method treats the market as a dynamic system, utilizing recurrence-based techniques to find patterns hidden in the noise of over two decades of trading history.
Beyond Correlation—The Non-Linear Reality of the Market
Traditional finance typically views stock relationships through a linear lens, assuming that if Stock A moves, Stock B will move proportionally. However, the researchers argue that these methods are insufficient because they miss the nuances of non-linear or lagged movements where one stock might react to another after a significant delay or in a complex, non-proportional manner. This “non-linear reality” means that stocks can be deeply connected even when their correlation coefficients appear low. Understanding these hidden synchronization patterns is a game-changer for modern portfolio construction. By identifying how stocks truly move in tandem across different market cycles, investors can develop more robust predictive models that account for systemic “synchronicity” rather than just surface-level trends. As noted in the research motivation: “Understanding of the price movements can help in building better predictive models which can be used to construct profitable portfolios.”
Visualizing Chaos with Multidimensional Cross Recurrence Plots (CRPs)
To capture these complex dynamics, the study employed Cross Recurrence Plots (CRPs), a technique originating in the study of dynamical systems in physics. Unlike standard charts, the researchers used a multidimensional approach, analyzing a four-part time series for each pair: the daily closing Price and Volume for Stock A, and the daily closing Price and Volume for Stock B. To ensure the data was embedded correctly into a higher-dimensional space, we utilized the “False Nearest Neighbors” method to determine the optimal consistency across the 20-stock universe.The study focused on 20 highly-capitalized stocks across 14 different sectors, generating 190 unique pairs for analysis. This method is particularly powerful because it can detect “phase transitions and critical points”—sudden, sharp changes in market behavior that standard linear charts often ignore. By calculating the actual distances between points in a phase diagram, the CRPs extract the “synchronization dynamics” that define how different sectors interact under pressure.
Why RNNs and LSTMs are the “Memory” the Market Needs
While CRPs provide the mathematical framework, the research utilized Deep Learning to predict future synchronization states. Recurrent Neural Networks (RNNs) and Long Short-Term Memory (LSTM) models were chosen for their ability to “remember” patterns in sequential data. Before feeding the data into the AI, we carried out a critical preprocessing step: we averaged the distance matrices into “mean of 3×3 blocks” to make the high-dimensional data manageable for the neural networks. The LSTM model architecture was meticulously designed for precision and stability, featuring:
- Two LSTM layers: These utilize the activation function to process the extracted distance sequences.
- Dropout layers: Set at a rate of 0.2, these provide regularization to prevent the model from over-fitting to historical noise.
- Adam optimizer: Used to efficiently minimize error during the training of over 3,600 data points. To evaluate success, metrics such as MAE, RMSE, R-square, and MAPE were used. The precision of the model is most evident in the “actual vs. predicted” distance graphs, where the predicted yellow lines track the actual green lines with remarkable fidelity. Most impressively, the LSTM was able to accurately mirror the chaotic spikes in distance—those specific moments where two stocks suddenly diverged or “desynchronized” before returning to their normal state.

Takeaway 4: The Binary “Sync” Signal—Classifying Market States
The final step of the research transforms complex distance data into actionable signals for investors. By using the Heaviside function, we converted continuous distance measures into binary labels: Synchronous (1) or Non-synchronous (0) . A distance below a specific threshold indicates the stocks are moving in lockstep, while a distance above it suggests they are acting independently. We tested various thresholds, known as Recurrence Rates (RR) , ranging from 20% to 45%. A lower recurrence rate represents a more stringent definition of “sync,” while a higher rate is more inclusive of looser movements. To determine which threshold was most reliable, we used the Coefficient of Variance (CV) to rank the models; lower CV values indicated the most consistent performance across the 21-year dataset. This classification turns complex market noise into a clear signal, allowing traders to see exactly when the fundamental synchronization of a pair has broken down.