Author: Charu Sharma

  • Study Smarter with AI: How Gemini Notebook Can Transform the Way You Learn

    Study Smarter with AI: How Gemini Notebook Can Transform the Way You Learn

    “Work smarter, not harder.” It’s advice we’ve all heard, but today’s students often face an overwhelming amount of information. Between textbooks, class notes, assignments, coaching materials, and online resources, studying can feel more like managing information than actually learning it.

    Fortunately, Artificial Intelligence (AI) is changing the way students study. One of the most powerful tools available today is Gemini Notebook (earlier known as NotebookLM), an AI-powered learning assistant that helps students understand, organize, and remember what they study.

    Unlike many AI tools that search the internet for answers, Gemini Notebook works with your own study material. You upload your textbook chapters, class notes, PDFs, or lecture slides, and it becomes your personal study partner.

    Here are ways Gemini Notebook can help you study smarter.

    Revise an Entire Chapter in Just 15 Minutes

    Long chapters often discourage students from revising regularly. Gemini Notebook can quickly generate concise summaries that capture the key concepts, important formulas, definitions, and takeaways from your uploaded material.

    Instead of rereading 40 pages before an exam, you can begin with a structured summary and then focus on areas that need deeper understanding.

    This approach saves time while ensuring that revision remains focused and effective.

    One of the best ways to remember information is through active recall—testing yourself instead of simply reading.

    Gemini Notebook can automatically generate:

    • Multiple-choice questions
    • Short-answer questions
    • True/False questions
    • Flashcards
    • Revision checklists

    Imagine completing a chapter in Biology or Mathematics and instantly having a personalized quiz based on your own notes. Instead of searching for practice questions, you begin testing yourself immediately.

    This makes revision more engaging and helps identify weak areas early.

    Never Forget What You Study

    Many students experience the same frustration: they understand a topic today but forget most of it before the examination.

    Gemini Notebook acts like an intelligent knowledge organizer. Because it stores and references your uploaded material, you can quickly revisit previous concepts without searching through multiple notebooks and files.

    When used alongside regular revision techniques such as spaced repetition and self-testing, Gemini Notebook helps reinforce learning over time instead of relying on last-minute cramming.

    The result is better long-term retention and greater confidence during exams.

    Understand Difficult Concepts Faster

    Every student has encountered a chapter that feels impossible to understand.

    Whether it’s calculus, chemical equilibrium, genetics, or probability, Gemini Notebook allows you to ask questions about your own study material.

    You can ask it to:

    • Explain a concept in simpler language.
    • Give a step-by-step explanation.
    • Provide examples.
    • Compare two related ideas.
    • Clarify confusing definitions.
    • Connect topics from different chapters.

    Instead of spending hours trying to decode a difficult paragraph, students receive explanations tailored to the material they are already studying.

    Learning becomes less frustrating and much more interactive.

    Prepare More Effectively for Exams

    Exam preparation is not just about studying harder—it’s about studying strategically.

    Gemini Notebook can help students:

    • Create personalized revision plans.
    • Generate chapter-wise summaries.
    • Build quick revision sheets.
    • Prepare mock questions.
    • Identify frequently discussed concepts.
    • Review important definitions and formulas.
    • Organize notes from multiple subjects.

    With all your study resources in one place, you spend less time searching for information and more time mastering it.

    gemininotebook
    Remember: AI Is Your Study Partner, Not Your Substitute

    AI is incredibly powerful, but it should never replace your own thinking.

    The most successful students use Gemini Notebook to:

    • Understand concepts more clearly.
    • Organize their learning.
    • Practice regularly.
    • Revise efficiently.
    • Save time on repetitive tasks.

    They still solve problems themselves, write their own answers, and develop critical thinking skills.

    Think of Gemini Notebook as a personal tutor available whenever you need help—not someone who does your learning for you.

    How Freebirds Helps Students Use AI Responsibly rather than a shortcut.

    In our Study Smarter with AI workshops, students learn how to:

    • Organize study material in Gemini Notebook.
    • Generate effective summaries and revision notes.
    • Create quizzes and flashcards automatically.
    • Ask better questions to deepen understanding.
    • Build personalized study plans.
    • Prepare smarter for school and competitive examinations.
    • Develop responsible and ethical AI habits.

    The future belongs to students who know not only what to learn, but how to learn. AI tools like Gemini Notebook can make studying more efficient, more enjoyable, and more effective—when used wisely.

    Learning smarter starts with using the right tools. Let AI help you spend less time struggling with information and more time truly understanding it.
  • Beyond the Bell Curve: Mutual information based stock networks

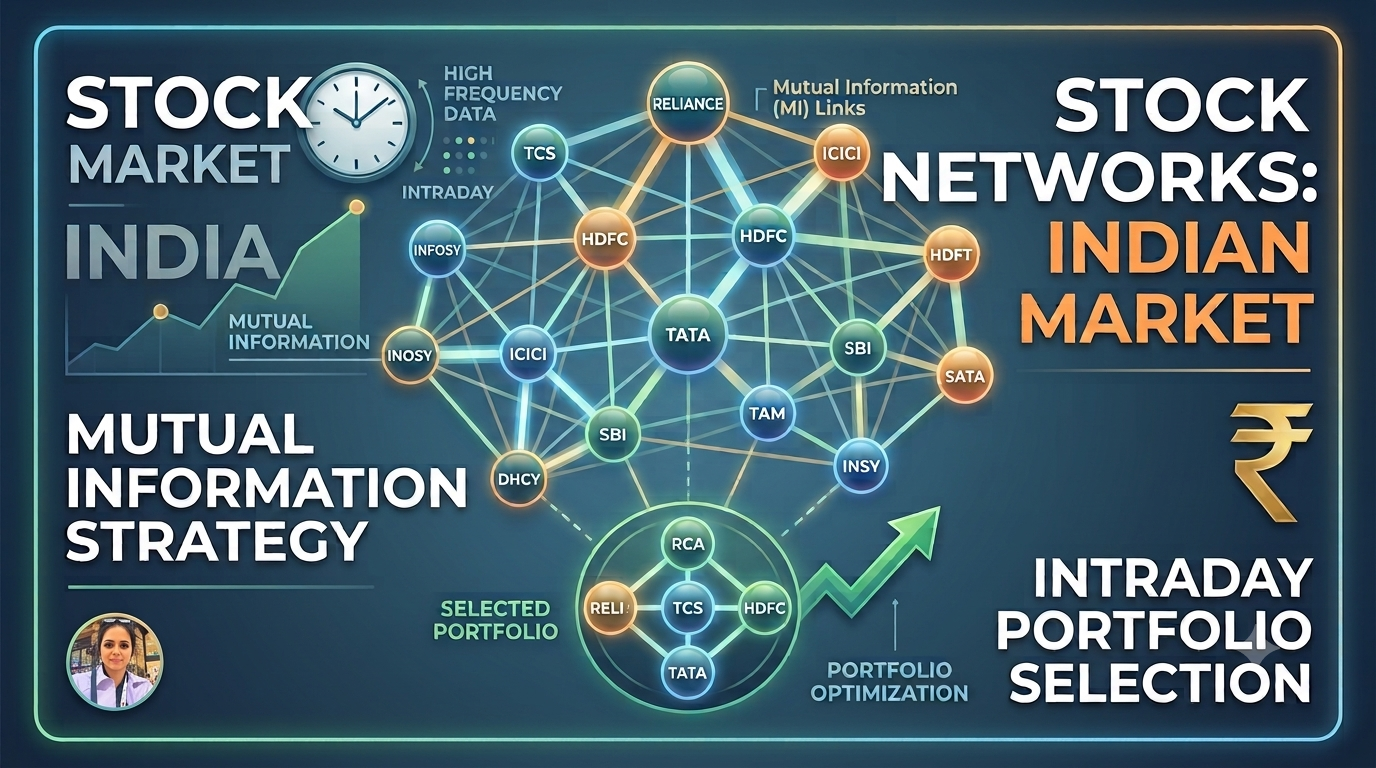
    Beyond the Bell Curve: Mutual information based stock networks

    In traditional quantitative finance, the structural failure of the Pearson correlation under non-Gaussian conditions often remains a massive blind spot. Most investors treat the market as a static spreadsheet of linear relationships, assuming that if Stock A moves, Stock B follows in a predictable straight line. However, when we zoom into the temporal dynamics of information flow—specifically at the 30-second “tick” level—the market reveals itself as a living, breathing network. By applying Random Matrix Theory (RMT) as a baseline for “noise dressing” and moving toward “Mutual Information” (MI), we can see the market’s hidden architecture. Derived from information theory, MI allows us to detect the “real” complex dependencies—both linear and non-linear—that traditional 20th-century models ignore. In emerging markets like India, where interactions are structurally stronger than in developed markets, this high-definition map is not just a theoretical luxury; it is a necessity for survival. In this article I am summarizing key findings from my research article jointly written by Prof Amber Habib, Professor Shiv Nadar University (https://doi.org/10.1371/journal.pone.0221910)

    The Structural Failure of the Pearson Correlation

    The most common tool in the strategist’s kit, the correlation coefficient, is fundamentally ill-equipped for high-frequency environments. Its primary flaw is its inability to detect non-linear dependencies. When we analyze the spectrum of the correlation matrix, we often find that while high correlation aligns with high MI, there is a substantial “non-linear data”—instances where stocks exhibit low correlation but high mutual information. As the source research emphasizes:  “If there is a non-linear relationship, the correlation coefficient may fail to capture it.”  For a quant, relying on linear-only thinking creates a dangerous false sense of security. If your risk models don’t account for these invisible threads, you are effectively flying blind through market turbulence, missing the deep dependencies that emerge when Gaussian assumptions break down.

    Speed Changes the Physics of Finance

    The rules of information flow shift dramatically based on the time scale. When analyzing daily returns, the discrepancy between linear correlation and mutual information is relatively stable. However, the “physics” changes at the high-frequency level. In 30-second intervals, non-linear interactions become significantly more pronounced. This suggests that market “noise” at the intraday level isn’t just random; it’s a dense web of rapid, non-linear bursts. For a strategist, this means a model optimized for long-term daily returns might be disastrous if applied to an algorithmic intraday strategy. At high frequencies, the market is less about fundamental valuation and more about the mechanics of how information propagates through the network.

    Systemic Fragility and the “Election Effect”

    We worked with 2014 data and observed that a major political events, such as the 2014 Indian general election, do more than just increase volatility—they reshape the entire topology of the stock network. During periods of political uncertainty, we observe a phenomenon where “common expectations” cause the market to move with collective intensity. From a network perspective, the scale-free property of the market undergoes a radical shift. In “normal” times, the power law exponent (α \alpha ) typically sits between 2 and 3. During the election, however,  α\alpha  dropped below 2. This drop indicates the emergence of a “thicker tail” and a proliferation of high-degree “hubs”—specifically in the  Financial Services and IT sectors .“During election time investors develop common expectations… market becomes volatile and at the same time stronger and more number of interactions are observed amongst the stocks. “When  α<2\alpha < 2“, systemic fragility spikes. The system-wide spike in mutual information signals a collapse of diversification benefits, as the “common expectation” forces almost every stock to react to the same central information hubs.

     Optimizing for the “Periphery”

    To visualize the market’s core, we use a Minimum Spanning Tree (MST)—a “skeleton” of the network that retains only the strongest connections while stripping away redundant loops. Within this skeleton, some stocks act as “hubs” (like ICICI Bank or PNB), while others sit on the “periphery”. Counter-intuitively, the boring periphery is where the intraday profit hides. Hubs possess high Eigenvector Centrality, meaning they are connected to other highly connected nodes. While this makes them central to information flow, it also makes them informationally overloaded and highly susceptible to systemic contagion. Conversely, peripheral stocks have low Eigenvector Centrality; their neighbors are also not central. By staying away from the center of the market noise, traders can find “pure” signals and better risk-adjusted returns, as these peripheral assets are more isolated from the chaotic fluctuations of the primary hubs.

    Precision over Breadth in Portfolio Selection

    A hallmark of modern portfolio theory is that broader is better. However, the data reveals a more nuanced reality for high-frequency environments. While a full 45-stock Markowitz model (maximizing the Sharpe ratio) performs best in absolute terms of the  return-to-stability ratio, it is often impractical for the “human” intraday trader or focused algorithms. The real breakthrough lies in small-cap constraints. When selecting small portfolios of 3, 5, or 10 stocks, MI-based peripheral selection significantly outperforms traditional correlation-based methods. Using entropy-based measures to pick a handful of peripheral stocks provides a more stable, efficient outcome than trying to manage the “clutter” of the entire CNX100. You don’t need to track 89 stocks to win; you just need to identify the 5 that are most informationally distinct from the noisy center.

    Conclusion: The Future is Entropic

    The 20th-century reliance on linear models is giving way to a 21st-century paradigm rooted in Information Theory. This case study of the Indian National Stock Exchange (NSE) proves that non-linearities are a hallmark of high-frequency trading, especially in emerging markets where interactions are more intense. As we look toward the future, the question for every quantitative strategist is simple: are you measuring the “real” complex connections in your portfolio using tools like Mutual Information and Adjacency Matrices, or are you still relying on the visible, linear illusions of the bell curve?

  • Beyond Correlation: How AI and Physics-Based Synchronization Are Decoding the Indian Stock Market’s Hidden Chaos

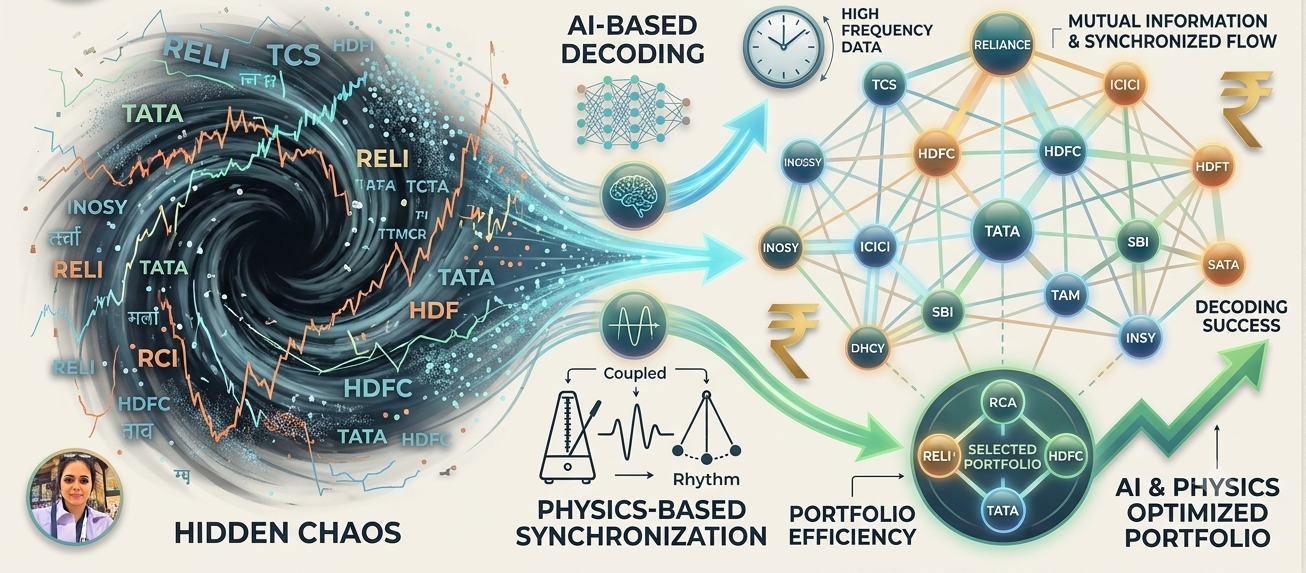
    Beyond Correlation: How AI and Physics-Based Synchronization Are Decoding the Indian Stock Market’s Hidden Chaos

    Traditional financial tools often struggle to capture the true complexity of how stocks move together. While many investors rely on simple linear correlation to understand market relationships, these standard methods frequently fail to account for the “messy,” non-linear, and lagged co-movements that define real-world trading. When markets turn volatile, these surface-level metrics often break down, leaving portfolios exposed to risks that traditional models never saw coming. One of my recent research with my student  Mr. Sanjay Sathish from the Shiv Nadar Institution of Eminence also presented at the 34th European Conference on Operational Research, offers a more sophisticated approach. By analyzing 21 years of Indian stock market data (2002–2023), we tried to move beyond simple price trends to train Artificial Intelligence on the concept of “synchronization.” This method treats the market as a dynamic system, utilizing recurrence-based techniques to find patterns hidden in the noise of over two decades of trading history.

    Beyond Correlation—The Non-Linear Reality of the Market

    Traditional finance typically views stock relationships through a linear lens, assuming that if Stock A moves, Stock B will move proportionally. However, the researchers argue that these methods are insufficient because they miss the nuances of non-linear or lagged movements where one stock might react to another after a significant delay or in a complex, non-proportional manner. This “non-linear reality” means that stocks can be deeply connected even when their correlation coefficients appear low. Understanding these hidden synchronization patterns is a game-changer for modern portfolio construction. By identifying how stocks truly move in tandem across different market cycles, investors can develop more robust predictive models that account for systemic “synchronicity” rather than just surface-level trends. As noted in the research motivation: “Understanding of the price movements can help in building better predictive models which can be used to construct profitable portfolios.”

    Visualizing Chaos with Multidimensional Cross Recurrence Plots (CRPs)

    To capture these complex dynamics, the study employed Cross Recurrence Plots (CRPs), a technique originating in the study of dynamical systems in physics. Unlike standard charts, the researchers used a multidimensional approach, analyzing a four-part time series for each pair: the daily closing Price and Volume for Stock A, and the daily closing Price and Volume for Stock B. To ensure the data was embedded correctly into a higher-dimensional space, we utilized the “False Nearest Neighbors” method to determine the optimal consistency across the 20-stock universe.The study focused on 20 highly-capitalized stocks across 14 different sectors, generating 190 unique pairs for analysis. This method is particularly powerful because it can detect “phase transitions and critical points”—sudden, sharp changes in market behavior that standard linear charts often ignore. By calculating the actual distances between points in a phase diagram, the CRPs extract the “synchronization dynamics” that define how different sectors interact under pressure.

    Why RNNs and LSTMs are the “Memory” the Market Needs

    While CRPs provide the mathematical framework, the research utilized Deep Learning to predict future synchronization states. Recurrent Neural Networks (RNNs) and Long Short-Term Memory (LSTM) models were chosen for their ability to “remember” patterns in sequential data. Before feeding the data into the AI, we carried out a critical preprocessing step: we averaged the distance matrices into “mean of 3×3 blocks” to make the high-dimensional data manageable for the neural networks. The LSTM model architecture was meticulously designed for precision and stability, featuring:

    • Two LSTM layers:  These utilize the  tanhtanh activation function  to process the extracted distance sequences.
    • Dropout layers:  Set at a rate of 0.2, these provide regularization to prevent the model from over-fitting to historical noise.
    • Adam optimizer:  Used to efficiently minimize error during the training of over 3,600 data points. To evaluate success, metrics such as MAE, RMSE, R-square, and MAPE were used. The precision of the model is most evident in the “actual vs. predicted” distance graphs, where the predicted yellow lines track the actual green lines with remarkable fidelity. Most impressively, the LSTM was able to accurately mirror the  chaotic spikes  in distance—those specific moments where two stocks suddenly diverged or “desynchronized” before returning to their normal state.
    image

    Takeaway 4: The Binary “Sync” Signal—Classifying Market States

    The final step of the research transforms complex distance data into actionable signals for investors. By using the Heaviside function, we converted continuous distance measures into binary labels:  Synchronous (1)  or  Non-synchronous (0) . A distance below a specific threshold indicates the stocks are moving in lockstep, while a distance above it suggests they are acting independently. We tested various thresholds, known as  Recurrence Rates (RR) , ranging from 20% to 45%. A lower recurrence rate represents a more stringent definition of “sync,” while a higher rate is more inclusive of looser movements. To determine which threshold was most reliable, we used the  Coefficient of Variance (CV)  to rank the models; lower CV values indicated the most consistent performance across the 21-year dataset. This classification turns complex market noise into a clear signal, allowing traders to see exactly when the fundamental synchronization of a pair has broken down.

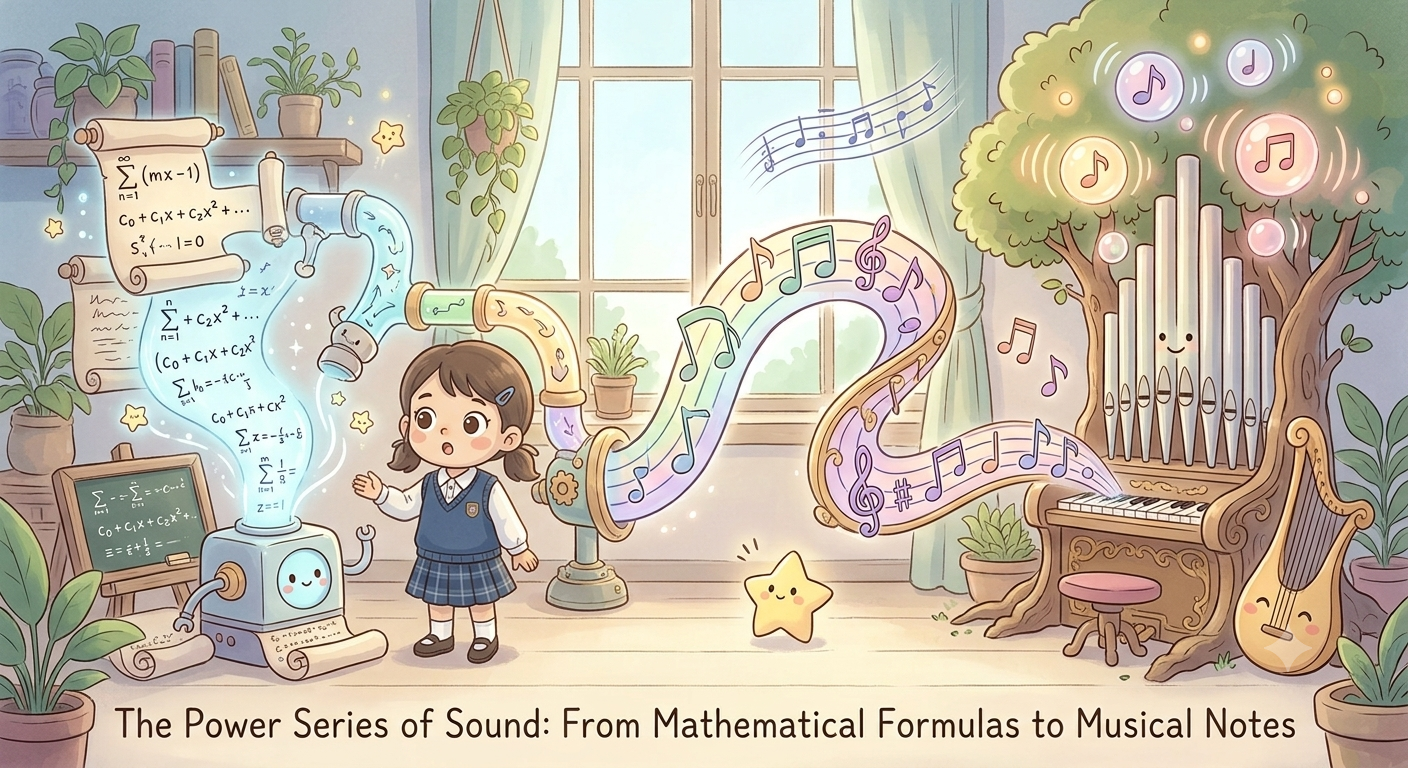
  • The Power Series of Sound: From Mathematical Formulas to Musical Notes

    The Power Series of Sound: From Mathematical Formulas to Musical Notes

    Music often feels like a purely emotional visitation, a “ghost” that haunts our senses and stirs our souls. Yet, stripped of its lyricism, sound is a calculation performed by the biology of the ear. When vibrations strike the eardrum, they are translated into electrical impulses that our brain interprets as pitch, timbre, and melody. To a mathematician, however, these vibrations are not merely noise; they are “periodic signals”—repeating patterns that form the structural skeleton of every song. We view these signals as the bridge between abstract sequences and the physical sensation of art. To build a sound, we must first learn to speak the language of its mathematical skeleton.

    How a Simple Straight Line Becomes a Song

    It is a profound, almost counter-intuitive truth that a complex melody is essentially an “infinite polynomial” masquerading as a wave. We demonstrate this through a special sequence of polynomials that “bend” a static linear equation into a shimmering sine wave.

    IImagine a graph of the simplest function: P1(x)=xP_1(x) = x. It is a rigid, diagonal line extending forever. But when we begin adding specific harmonic terms, a visual transformation occurs:

    P2(x)=xx33!:P_2(x) = x – \frac{x^3}{3!}: The line develops a subtle “hump” at the origin, losing its rigid linearity.

    P3(x)=xx33!+x55!P_3(x) = x – \frac{x^3}{3!} + \frac{x^5}{5!}: The curve begins to oscillate, creating the first hints of a ripple.

    Pn(x)=xx33!++(1)nx2n+1(2n+1)!P_n(x) = x – \frac{x^3}{3!} + \dots + \frac{(-1)^n x^{2n+1}}{(2n+1)!}: By the time we reach higher orders, the graph has “rippled” outward, mimicking the periodic rise and fall of a pure tone.

    picture2

    This is the power series expansion of sin(x)\sin(x). As we add terms, the function sheds its polynomial skin and becomes a wave.

    “A power series is an infinite polynomial.”

    When you listen to a clean note, you are hearing the auditory manifestation of this infinite mathematical progression.

    The “Magic Ratio” Hiding in Your Octaves

    The beauty of a scale is not a matter of chance; it is a strict adherence to geometric progression. In Western music, the “Octave” is the gold standard—an interval where the higher note vibrates at exactly twice the frequency of the lower note (2f02f_0).

    To divide this octave into the twelve familiar semitones of a piano (C, C#, D, etc.), mathematicians use a constant ratio, a. Since we must reach 2f02f_0 after twelve steps, the relationship is f0a12=2f0f_0 \cdot a^{12} = 2f_0, which simplifies to the “Magic Ratio”: a=21/12a = 2^{1/12}.

    The frequency ff of any note nn semitones away from a reference f0f_0 is: f=f02n/12f = f_0 \cdot 2^{n/12}

    For instance, if we set our reference frequency f0f_0 to 240Hz240 Hz (a common baseline in our demonstrations), we can precisely calculate the note ‘E’, which is 7 semitones away. The result,E=24027/12 E = 240 \cdot 2^{7/12}, provides a frequency that sounds perfectly “in tune” to the human ear. Musical harmony, then, is simply the sound of numbers moving in perfect, calculated steps.

    Coding “Happy Birthday” with Sine Waves

    Transitioning from theory to performance requires digital synthesis. Using Matlab, we can transform a computer into a literal instrument by sequencing sine functions. By assigning specific frequencies to the notes of a melody, we “compute” the music rather than recording it.

    Consider the opening of “Happy Birthday.” According to this methodology, we assign the following frequencies from the standard Octave 3 and 4 scales:

    • A: 220 Hzsin(220x)220\text{ Hz} \rightarrow \sin(220 \cdot x)
    • B:246.94 Hzsin(246.94x) 246.94\text{ Hz} \rightarrow \sin(246.94 \cdot x)
    • D: 293.66 Hzsin(293.66x)293.66\text{ Hz} \rightarrow \sin(293.66 \cdot x)
    • C#: 277.18 Hzsin(277.18x)277.18\text{ Hz} \rightarrow \sin(277.18 \cdot x)

    The sequence for the first line of the song becomes a series of mathematical instructions: A, A, B, A, D, C#. In this environment, the “musician” is a coder, and the “instrument” is the sinesine function, proving that even our most cherished celebratory melodies are built from the same numerical blocks as a calculus problem.

    The Sine Wave isn’t the Only Soloist

    While the sinesine wave is the “purest” building block, the mathematical orchestra is vast. Is sin(x)\sin(x) the only function capable of music? Certainly not. Texture and “color” in sound come from exploring different periodic signals.

    Mathematics offers alternatives like cos(x)\cos(x) or the “sawtooth” wave. Unlike the smooth, rounded oscillations of a sine wave, the sawtooth wave—visualized as a series of jagged, linear ramps that reset abruptly—creates a harsher, “buzzier” timbre. While the sinesine wave provides the foundation, these alternative functions allow us to synthesize the diverse “voices” of different instruments. In the world of synthesis, changing the equation is equivalent to switching from a flute to a violin.

    A Language for Scientific Wonders

    I strongly believe that mathematics is “a language to most scientific and technical problems.” Music is perhaps the most beautiful of these problems. When we apply this language to the “ghost” in our eardrums, we find that what we once perceived as pure emotion is actually a series of beautifully solved equations.

    If a simple polynomial can be bent and rippled into a musical masterpiece, what other “art” is currently hiding in your data? The next time you hit play on your favorite playlist, listen closely—you aren’t just hearing a song; you are hearing the elegant resonance of a geometric progression.

  • Empowering Future Thinkers: The New CBSE CT-AI Curriculum

    Empowering Future Thinkers: The New CBSE CT-AI Curriculum

    Artificial Intelligence (AI) is no longer a distant future; it is a present reality that students interact with daily through YouTube recommendations, voice assistants, and search engines. However, while many students use these tools, there is often a low awareness of how AI actually works or how to use it responsibly. To address this, the National Education Policy (NEP) 2020 aims to position India as a global leader by integrating AI, Machine Learning, and Computational Thinking (CT) into school education.

    A Global Shift in Education

    India is joining a global movement to prioritize digital literacy. Many countries have already taken significant steps:

    • Finland, the United States, and China are all embedding AI literacy into their K-12 systems to ensure their students are prepared for an AI-rich future.
    • Singapore has launched an EdTech Masterplan for structured AI learning.
    • The United Arab Emirates has made AI a mandatory subject in government schools starting in 2025-26.

    How CBSE is Incorporating CT-AI

    CBSE’s new curriculum for Classes 3 to 8 is designed to create AI-literate learners by 2030. The board is taking a unique, phased approach that focuses on Computational Thinking as the foundation for AI.

    • Preparatory Stage (Classes 3–5): The focus is entirely on Computational Thinking. Learning is “unplugged” and integrated into existing Mathematics and “The World Around Us” periods, using puzzles and worksheets rather than requiring constant computer access.
    • Middle Stage (Classes 6–8): Students move into Introductory AI literacy and advanced CT. They explore how machines learn (Supervised, Unsupervised, and Reinforcement Learning) through simple, everyday analogies.
    • Real-World Projects: Students will engage in interdisciplinary projects (40 hours per year), such as analyzing weather patterns or designing nutritional meal planners, to see how technology solves community problems.

    Beyond Coding: Skills for Life

    The curriculum emphasizes that thinking is more important than the correct answer. By breaking big problems into smaller parts (Decomposition) and spotting Patterns, students build the “cognitive scaffolding” needed for AI literacy. Furthermore, a core component of the curriculum is Ethics, teaching students to critically analyze bias, fairness, and privacy in digital models.

    To support this journey, CBSE has released Student and Teacher Resource Books (https://cbseacademic.nic.in/ct-ai.html) that act as companions to NCERT Mathematics textbooks. These resources ensure that technology education is not an “extra load” but a seamless part of daily learning, helping our children become informed, capable, and responsible digital citizens.

    gemini generated image bsml7tbsml7tbsml