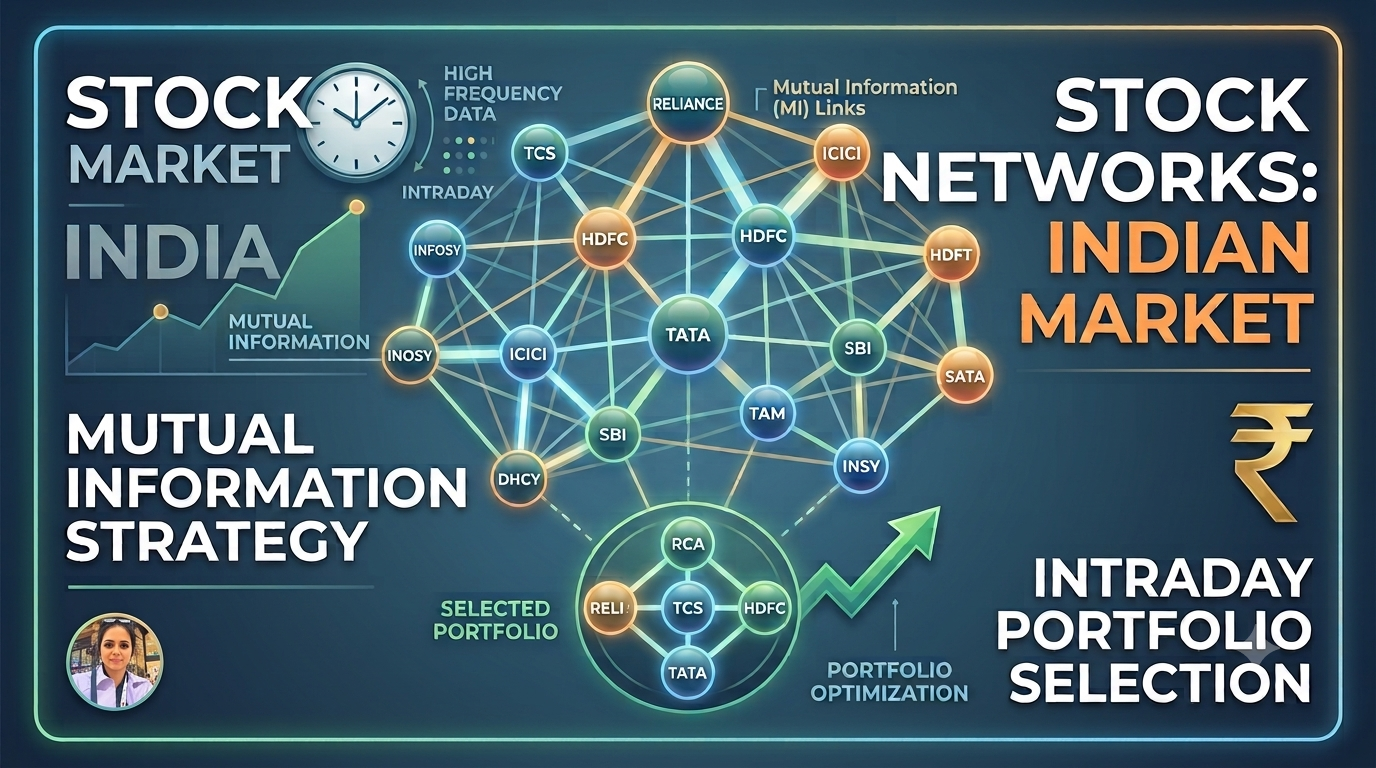
In traditional quantitative finance, the structural failure of the Pearson correlation under non-Gaussian conditions often remains a massive blind spot. Most investors treat the market as a static spreadsheet of linear relationships, assuming that if Stock A moves, Stock B follows in a predictable straight line. However, when we zoom into the temporal dynamics of information flow—specifically at the 30-second “tick” level—the market reveals itself as a living, breathing network. By applying Random Matrix Theory (RMT) as a baseline for “noise dressing” and moving toward “Mutual Information” (MI), we can see the market’s hidden architecture. Derived from information theory, MI allows us to detect the “real” complex dependencies—both linear and non-linear—that traditional 20th-century models ignore. In emerging markets like India, where interactions are structurally stronger than in developed markets, this high-definition map is not just a theoretical luxury; it is a necessity for survival. In this article I am summarizing key findings from my research article jointly written by Prof Amber Habib, Professor Shiv Nadar University (https://doi.org/10.1371/journal.pone.0221910)
The Structural Failure of the Pearson Correlation
The most common tool in the strategist’s kit, the correlation coefficient, is fundamentally ill-equipped for high-frequency environments. Its primary flaw is its inability to detect non-linear dependencies. When we analyze the spectrum of the correlation matrix, we often find that while high correlation aligns with high MI, there is a substantial “non-linear data”—instances where stocks exhibit low correlation but high mutual information. As the source research emphasizes: “If there is a non-linear relationship, the correlation coefficient may fail to capture it.” For a quant, relying on linear-only thinking creates a dangerous false sense of security. If your risk models don’t account for these invisible threads, you are effectively flying blind through market turbulence, missing the deep dependencies that emerge when Gaussian assumptions break down.
Speed Changes the Physics of Finance
The rules of information flow shift dramatically based on the time scale. When analyzing daily returns, the discrepancy between linear correlation and mutual information is relatively stable. However, the “physics” changes at the high-frequency level. In 30-second intervals, non-linear interactions become significantly more pronounced. This suggests that market “noise” at the intraday level isn’t just random; it’s a dense web of rapid, non-linear bursts. For a strategist, this means a model optimized for long-term daily returns might be disastrous if applied to an algorithmic intraday strategy. At high frequencies, the market is less about fundamental valuation and more about the mechanics of how information propagates through the network.
Systemic Fragility and the “Election Effect”
We worked with 2014 data and observed that a major political events, such as the 2014 Indian general election, do more than just increase volatility—they reshape the entire topology of the stock network. During periods of political uncertainty, we observe a phenomenon where “common expectations” cause the market to move with collective intensity. From a network perspective, the scale-free property of the market undergoes a radical shift. In “normal” times, the power law exponent () typically sits between 2 and 3. During the election, however, dropped below 2. This drop indicates the emergence of a “thicker tail” and a proliferation of high-degree “hubs”—specifically in the Financial Services and IT sectors .“During election time investors develop common expectations… market becomes volatile and at the same time stronger and more number of interactions are observed amongst the stocks. “When “, systemic fragility spikes. The system-wide spike in mutual information signals a collapse of diversification benefits, as the “common expectation” forces almost every stock to react to the same central information hubs.
Optimizing for the “Periphery”
To visualize the market’s core, we use a Minimum Spanning Tree (MST)—a “skeleton” of the network that retains only the strongest connections while stripping away redundant loops. Within this skeleton, some stocks act as “hubs” (like ICICI Bank or PNB), while others sit on the “periphery”. Counter-intuitively, the boring periphery is where the intraday profit hides. Hubs possess high Eigenvector Centrality, meaning they are connected to other highly connected nodes. While this makes them central to information flow, it also makes them informationally overloaded and highly susceptible to systemic contagion. Conversely, peripheral stocks have low Eigenvector Centrality; their neighbors are also not central. By staying away from the center of the market noise, traders can find “pure” signals and better risk-adjusted returns, as these peripheral assets are more isolated from the chaotic fluctuations of the primary hubs.
Precision over Breadth in Portfolio Selection
A hallmark of modern portfolio theory is that broader is better. However, the data reveals a more nuanced reality for high-frequency environments. While a full 45-stock Markowitz model (maximizing the Sharpe ratio) performs best in absolute terms of the return-to-stability ratio, it is often impractical for the “human” intraday trader or focused algorithms. The real breakthrough lies in small-cap constraints. When selecting small portfolios of 3, 5, or 10 stocks, MI-based peripheral selection significantly outperforms traditional correlation-based methods. Using entropy-based measures to pick a handful of peripheral stocks provides a more stable, efficient outcome than trying to manage the “clutter” of the entire CNX100. You don’t need to track 89 stocks to win; you just need to identify the 5 that are most informationally distinct from the noisy center.
Conclusion: The Future is Entropic
The 20th-century reliance on linear models is giving way to a 21st-century paradigm rooted in Information Theory. This case study of the Indian National Stock Exchange (NSE) proves that non-linearities are a hallmark of high-frequency trading, especially in emerging markets where interactions are more intense. As we look toward the future, the question for every quantitative strategist is simple: are you measuring the “real” complex connections in your portfolio using tools like Mutual Information and Adjacency Matrices, or are you still relying on the visible, linear illusions of the bell curve?